前言:本文主要参考了来自coursera上约翰霍普金斯大学Data Science系列课程Course3:Getting and Cleaning Data.
Tips
- 记录你的每一步操作
- 变量名应当取得比较详尽,不要缩写
- 善用??
Data collection
set path
1 | setwd("C:/Users/msgsxj/Desktop/coursera/Getting and Cleaning Data") |
create directories
1 | if (!file.exists("data")){ |
get data
from csv
- utils包中函数:
- download.file():如果是https开头,mac需要指定method = "curl",win不需要;如果是http开头则都不需要
1 | setwd("C:/Users/msgsxj/Desktop/coursera/Getting and Cleaning Data") |
- utils包中函数:
- read.table()
- read.csv()
1 | cameraData <- read.table("./data/cameras.csv", sep = ",", header = TRUE) |
- 重复读取1000次,两种方式读取csv所花时间对比
- read.table():1.862808 secs
- read.csv():1.861519 secs
1 | t1 <- Sys.time() |
from xlsx
- 首先用excel手动将cameras.csv转存为cameras.xlsx
- readxl包中函数:
- read_excel()
1 | setwd("C:/Users/msgsxj/Desktop/coursera/Getting and Cleaning Data") |
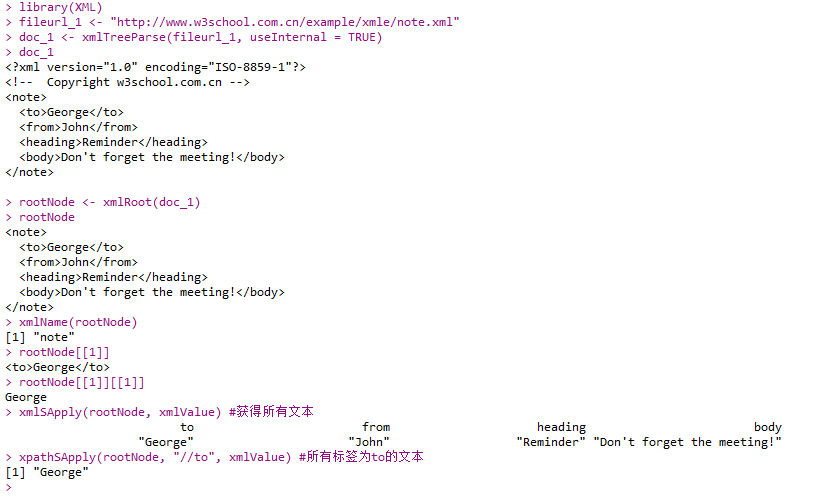
from xml
- XML包中函数:
- xmlTreeParse()
- xmlRoot()
- xmlName()
- xmlSApply()
- xpathSApply()
1 | install.packages("XML") |
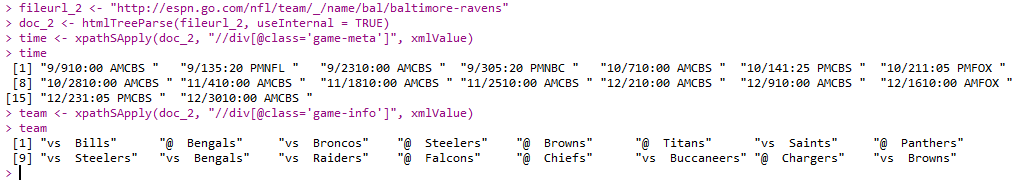
- 另一个例子
1 | fileurl_2 <- "http://espn.go.com/nfl/team/_/name/bal/baltimore-ravens" |
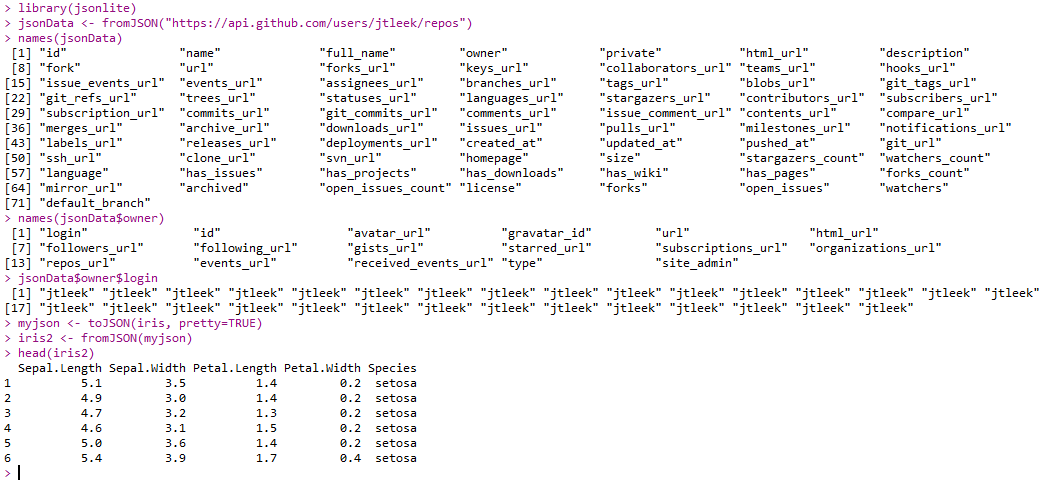
from JSON
- json结构有点类似xml,应用广泛,也是通过API获得的数据的最常见类型
- jsonlite包中函数:
- fromJSON()
- toJSON()
1 | library(jsonlite) |
from MySQL
- DBI包中函数:
- dbConnect()
- dbGetQuery()
- RMySQL包中函数:
- MySQL()
1 | library(DBI) |
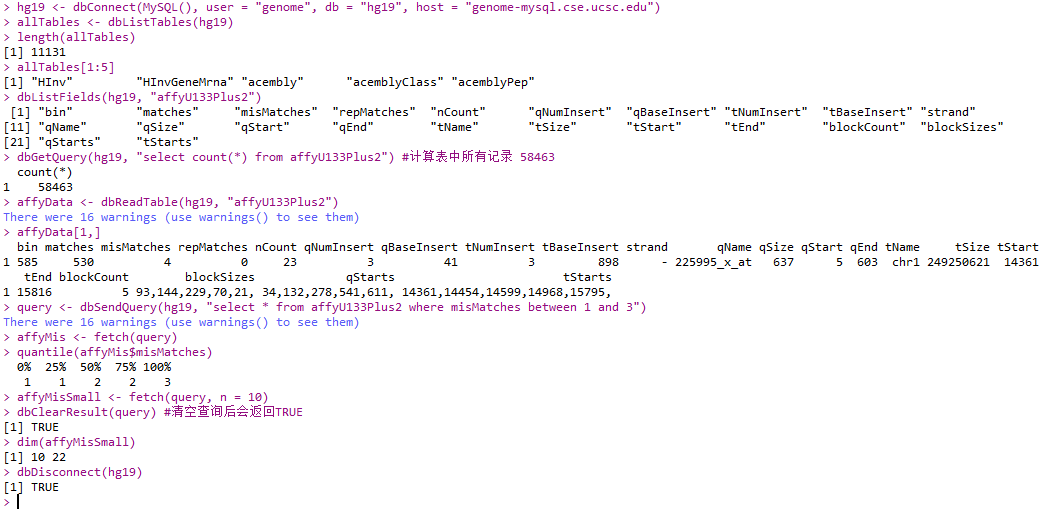
- 一个数据库的例子:hg19
- DBI包中函数:
- dbListTables()
- dbReadTable()
- dbSendQuery()
- fetch()
- dbClearResult()
- dbDisconnect()
1 | hg19 <- dbConnect(MySQL(), user = "genome", db = "hg19", host = "genome-mysql.cse.ucsc.edu") |
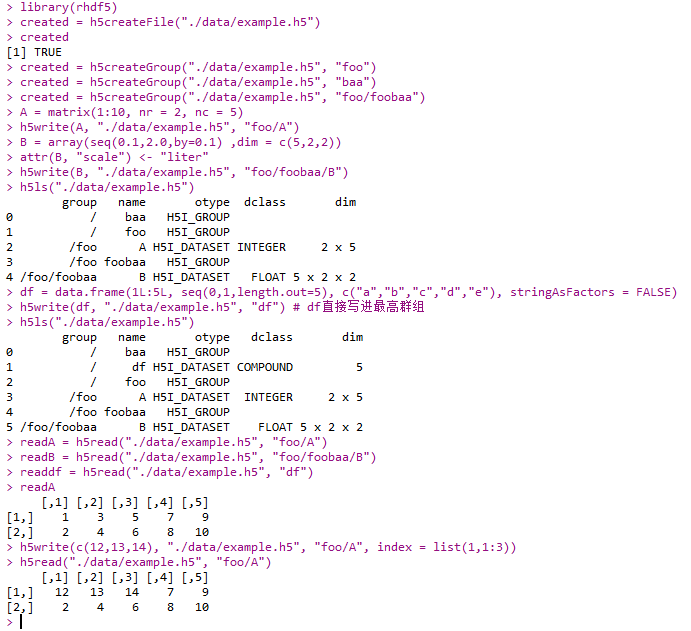
from HDF5
- 官网:https://support.hdfgroup.org/HDF5/
- Hierarchical Data Format(层次型数据结构)
- rhdf5包中函数:
- h5createFile()
- h5createGroup()
- h5write()
- h5ls()
- h5read()
1 | setwd("C:/Users/msgsxj/Desktop/coursera/Getting and Cleaning Data") |
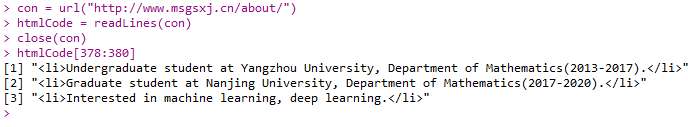
from The Web
- base包中函数:
- url()
- readLines()
1 | con = url("http://www.msgsxj.cn/about/") |
- XML包中函数:
- htmlTreeParse()
- htmlParse()
- xpathSApply()
- httr包中函数:
- GET()
- content()
1 | library(XML) |
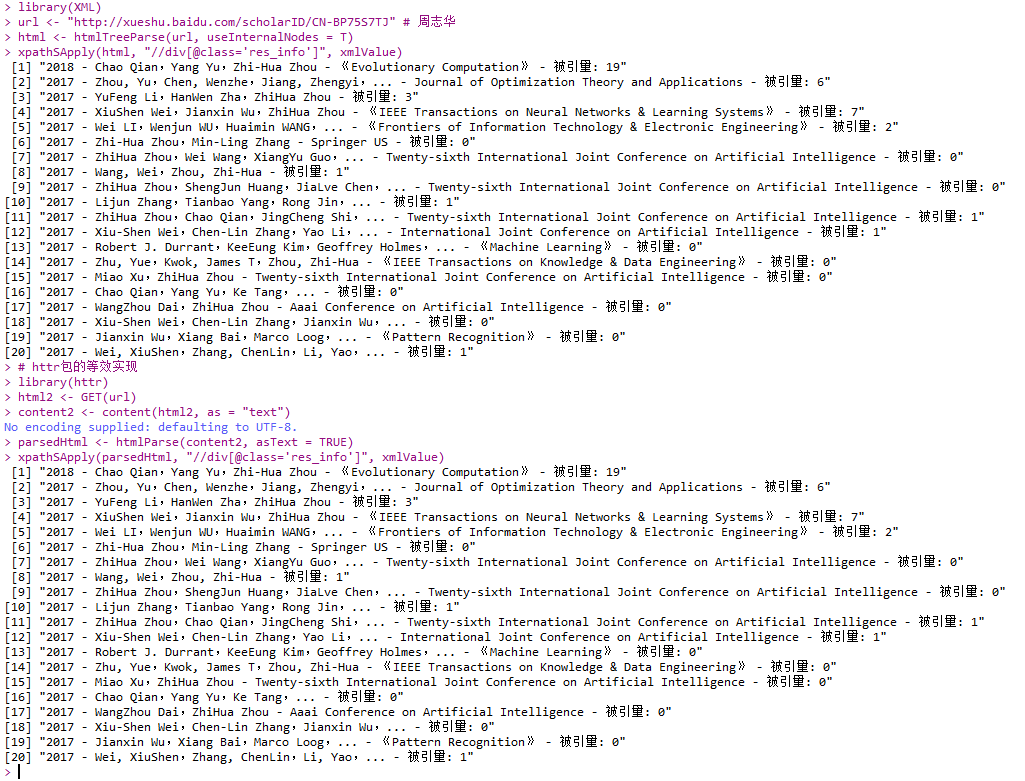
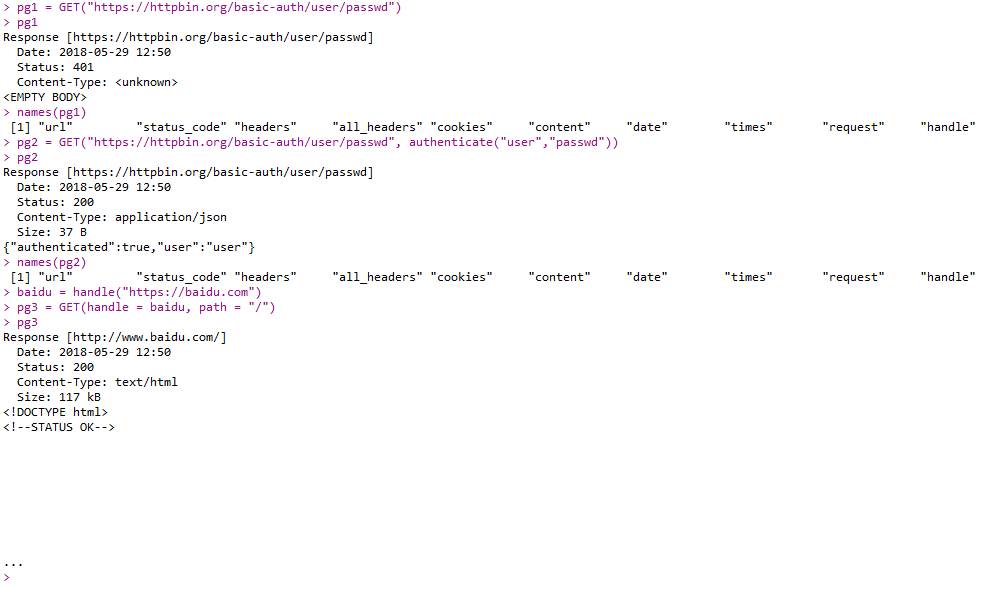
- httr包中函数:
- GET():websites with passwords
- handle()
1 | pg1 = GET("https://httpbin.org/basic-auth/user/passwd") |
from API
1 | library(httr) |
from other sources
- 下列函数或包自行查询文档:
- file()
- url()
- gzfile()
- bzfile()
- read.arff()(Weka)
- read.dta()(Stata)
- read.mtp()(Minitab)
- read.octave()(Octave)
- read.spss()(SPSS)
- read.xport()(SAS)
- read_fwf(.for)
- RPostresSQL包(provide a DBI-compliant(兼容数据库接口)的数据库连接)
- RODBC包(为PostgreQL,MySQL,Microsoft Accsee SQLite提供接口)
- RMongo包,rmongodb包(MongoDB)
- jpeg(),readbitmap(),png(),EBImage包(读取图像数据)
- rdgal包,rgeos包,raster包(读取GIS(Geographic Information System)数据)
- tuneR包,seewave包(读取MP3)
Some Data Resources
- United Bations:http://data.un.org/
- U.S.:http://www.data.gov/
- United Kingdom:http://data.gov.uk/
- France http://www.data.gouv.fr/
- Ghana:http://data.gov.gh/
- Australia:http://data.gov.au/
- Grenamy:http://www.govdata.de/
- Hong Kong:http://www.gov.hk/en/theme/psi/datasets/
- Janpan:http://www.data.go.jp/
- Many more:http://www.data.gov/opendatasites
- http://www.gapminder.org/
- http://www.asdfree.com/
- http://www.kaggle.com/
- Hilary Mason:http://bitly.com/bundles/hmason/1
- Jeff Hammerbacher:http://www.quora.com/Jeff-Hammerbacher/Introduction-to-Data-Science-Data-Sets
Making data tidy
Subsetting and Sorting
Subsetting
- X[]
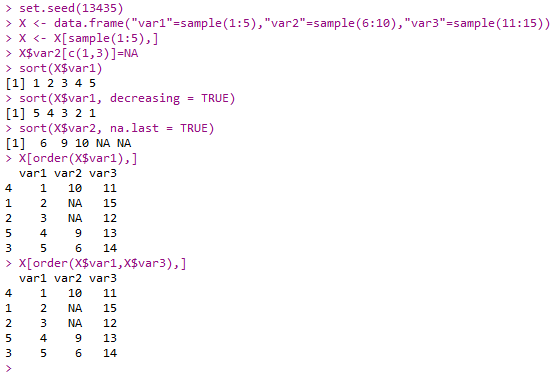
1 | set.seed(13435) |
![X[]](/pictures/R/R_X%5B%5D.png)
Sorting
- base包中函数:
- sort()
- order()
1 | set.seed(13435) |
- plyr包中函数:
- arrange()
1 | library(plyr) |
- base包中函数:
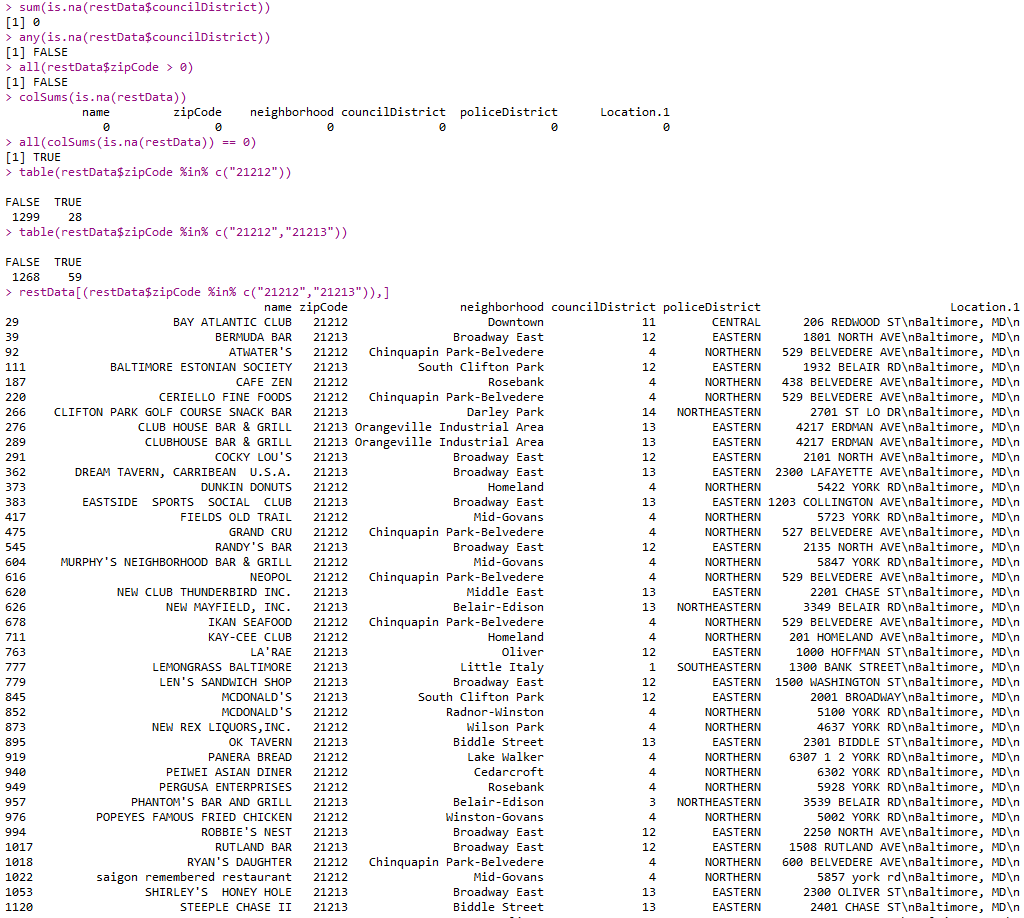
- is.na()
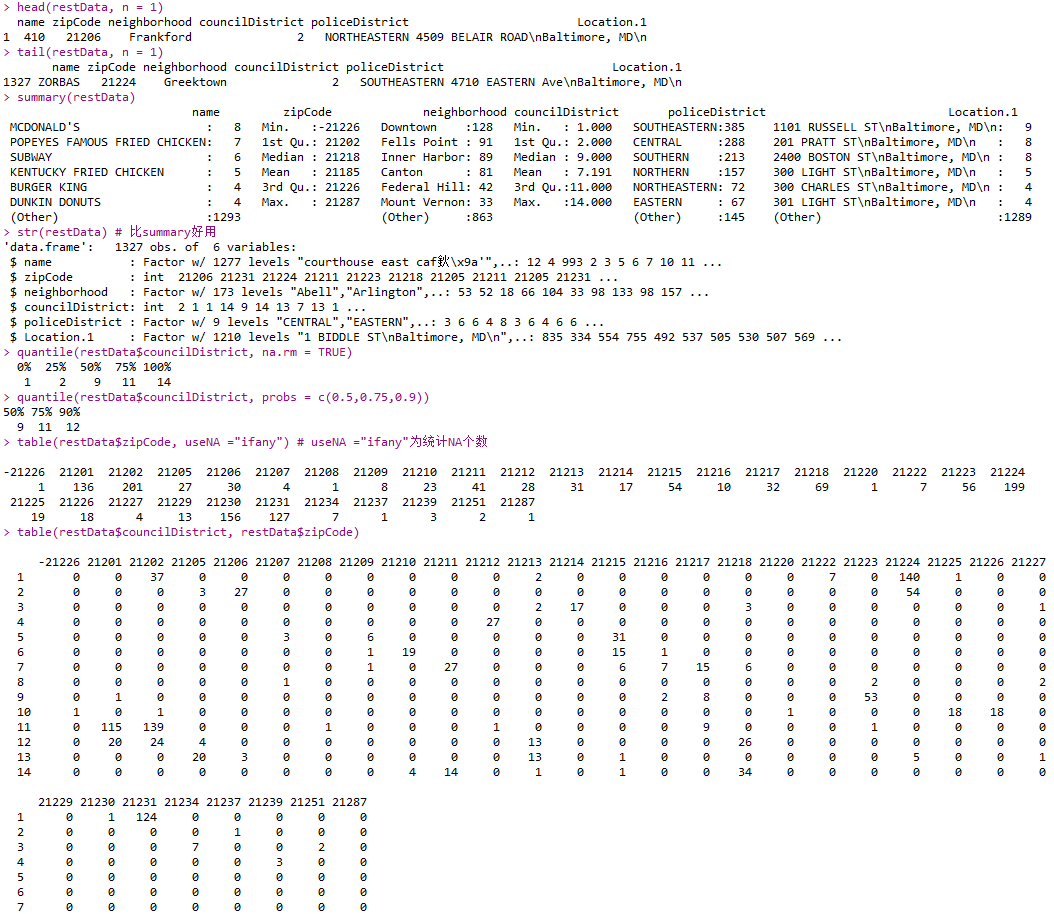
1 | sum(is.na(restData$councilDistrict)) |
- base包中函数:
- as.data.frame()
- stats中函数:
- xtabs()
- ftable()
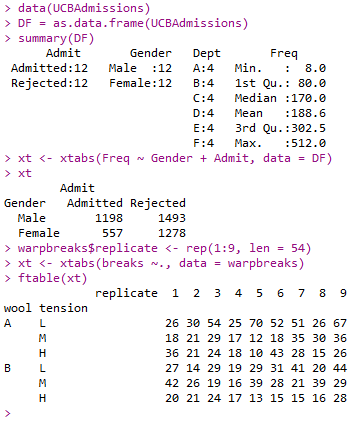
1 | data(UCBAdmissions) |
- utils包中函数:
- object.size()
1 | fakeData = rnorm(1e5) |
Creating new Variables
- 下载数据
1 | setwd("C:/Users/msgsxj/Desktop/coursera/Getting and Cleaning Data") |
Create sequences
- base包中函数:
- seq()
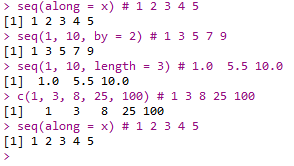
1 | seq(1, 10, by = 2) # 1 3 5 7 9 |
Create binary variables
- base包中函数:
- ifelse()
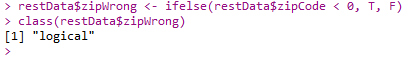
1 | restData$zipWrong <- ifelse(restData$zipCode < 0, T, F) |
Create categorical variables
- base包中函数:
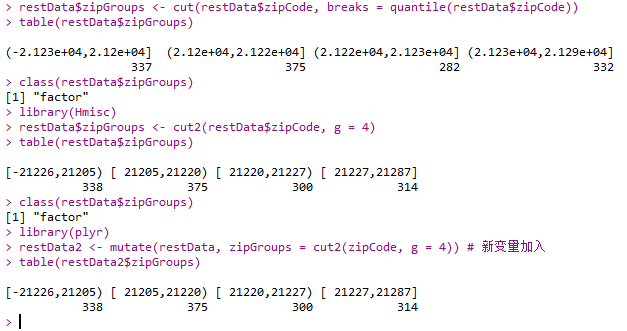
- cut()
- Hmisc包中函数:
- cut2()
- plyr包中函数:
- mutate()
1 | install.packages("Hmisc") |
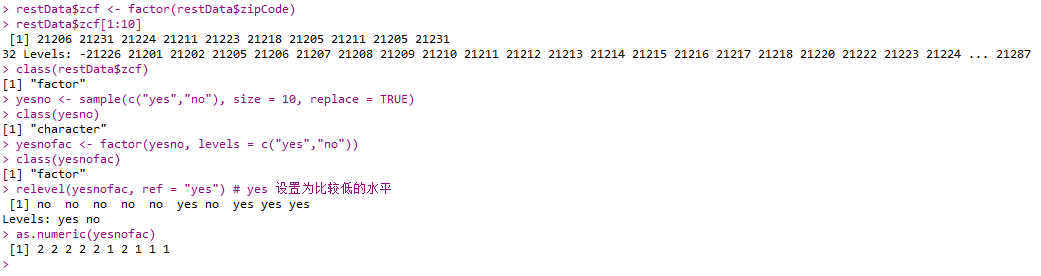
- base包中函数:
- factor()
- stats包中函数:
- relevel()
1 | restData$zcf <- factor(restData$zipCode) |
Common transforms
- abs()
- sqrt()
- ceiling()
- floor()
- round(x, digits = n) # 小数点后有效数字
- signif(x, digits = n) # 一共有效数字
- cos()
- log()
- log2()
- log10()
- exp()
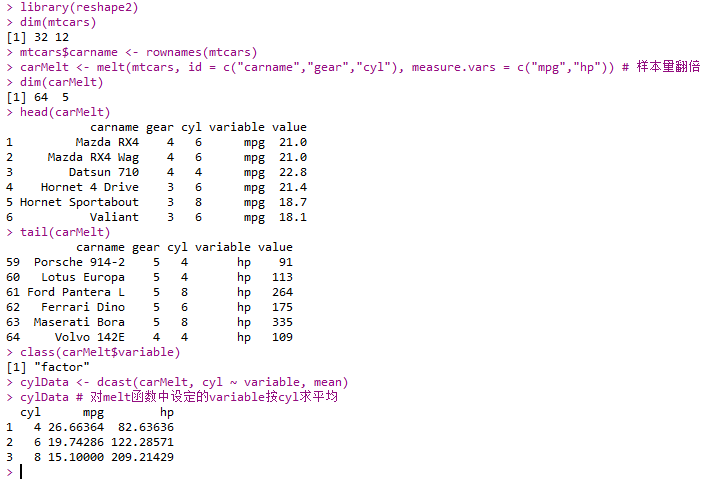
Reshaping Data
- reshape2包中函数:
- melt()
- dcast()
1 | library(reshape2) |
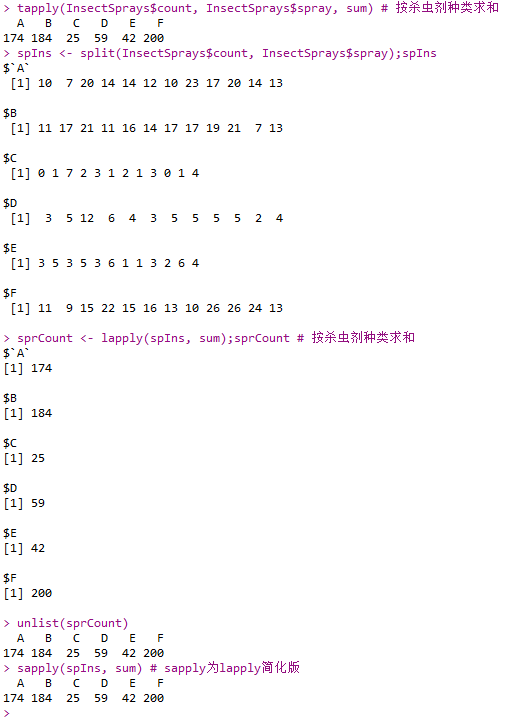
- base包中函数:
- tapply()
- split()
- lappy()
- unlist()
- sapply()
1 | tapply(InsectSprays$count, InsectSprays$spray, sum) # 按杀虫剂种类求和 |
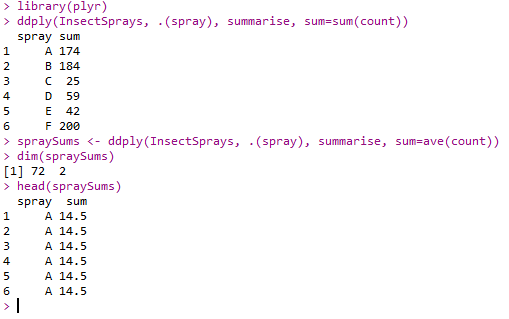
- plyr包中函数:
- ddply()
1 | library(plyr) |
Editing Text Variable
- 下载数据
1 | setwd("C:/Users/msgsxj/Desktop/coursera/Getting and Cleaning Data") |
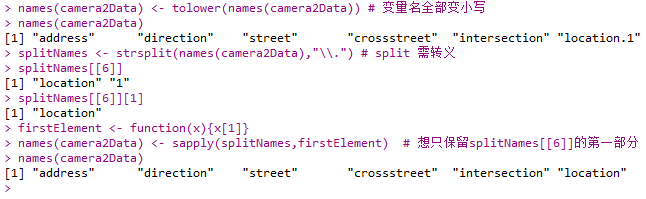
- base包中函数:
- tolower()
- strsplit()
- sapply()
1 | names(camera2Data) <- tolower(names(camera2Data)) # 变量名全部变小写 |
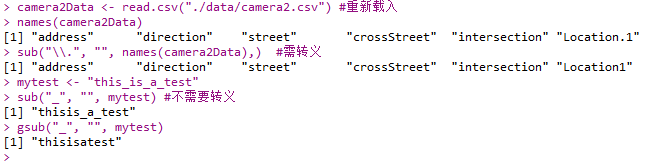
- 上述srtsplit()+sapply()过程的相似处理:用""取代"."
- sub()
- gsub() 替换所有
1 | camera2Data <- read.csv("./data/camera2.csv") #重新载入 |
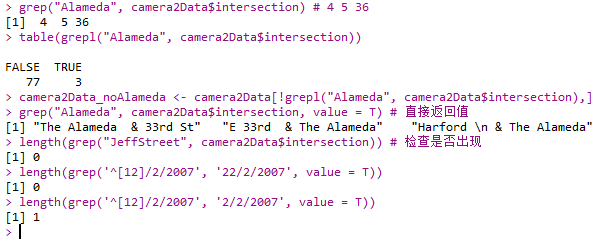
- base包中函数:
- grep()
- grepl():返回一列logical
- 更多正则表达式规则见维基百科
1 | grep("Alameda", camera2Data$intersection) # 4 5 36 |
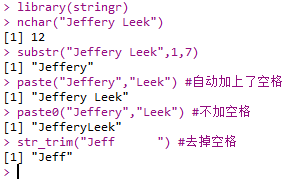
- base包中函数:
- nchar()
- substr()
- paste()
- paste0()
- stringr包中函数:
- str_trim()
1 | library(stringr) |
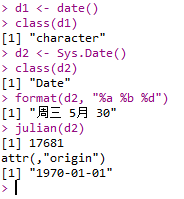
Date
- base包中函数:
- date()
- Sys.Date()
1 | d1 <- date() |
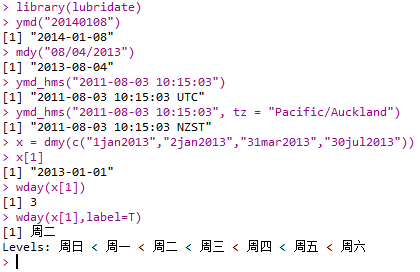
- lubridate包中函数:
- ymd()
- ymd_hms()
- dmy():返回日期
- wday():返回星期
1 | library(lubridate) |
一些强大的技巧
%>%
- %>%:管道函数
- 下面两条代码等价
1 | anscombe_tidy <- anscombe %>% mutate(observation = seq_len(n())) |
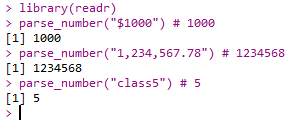
parse_number()
- readr包中函数:
- parse_number():获得数字
1 | library(readr) |
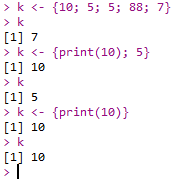
print(10)
1 | k <- {10; 5; 5; 88; 7} # 取最后一个赋值 |
data.table package
- data.table继承于data.frame
1 | library(data.table) |
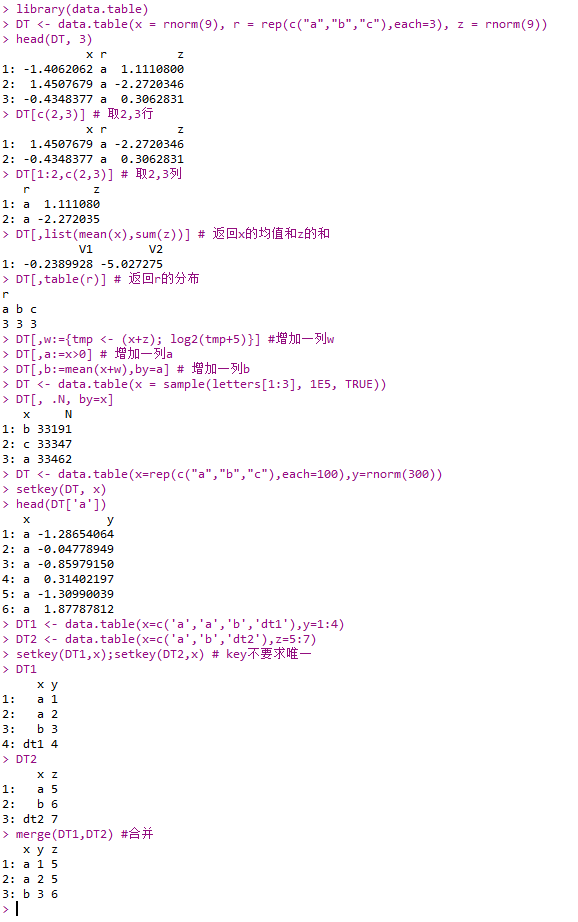
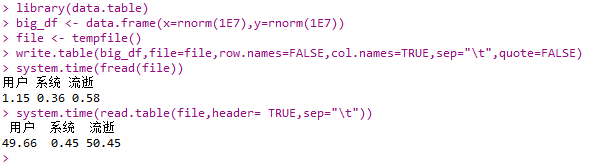
- fread():读取数据特别快
1 | library(data.table) |
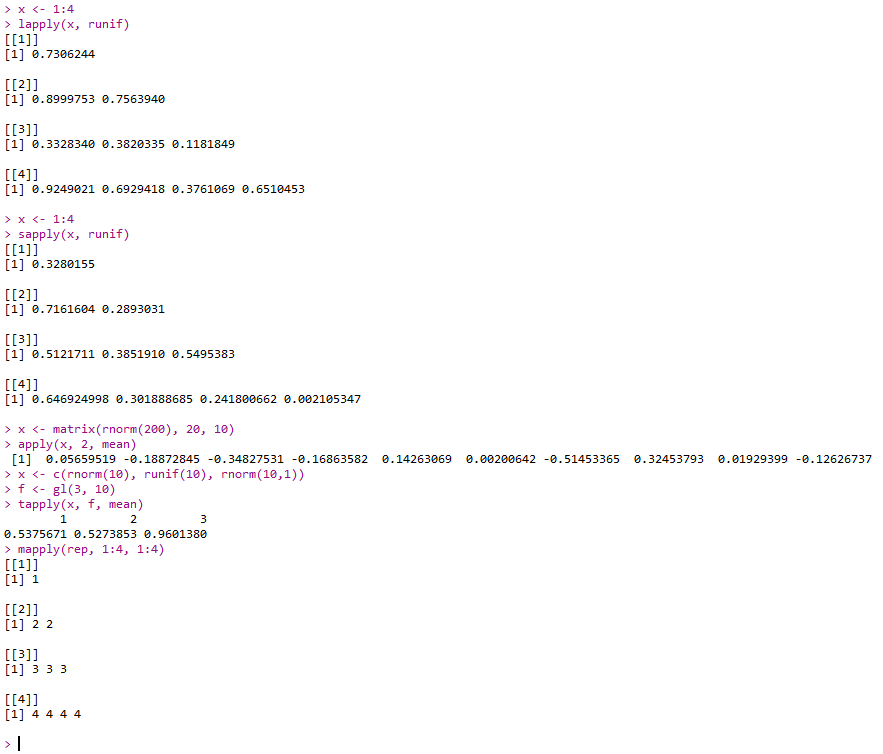
lapply,aspply,apply,tapply,mapply
- lappy:loop over a list and evaluate a function on each element
- sapply:same as lappy but try to simplify the result
- apply:apply a function over the margins of any array
- tapply:apply a function over subsets of a vector
- mapply:multivariate version of lapply
1 | x <- 1:4 |
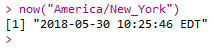
now()
- now():可查看指定城市时间
- 可查城市
1 | now("America/New_York") |